9 Biomarker Discovery
Biomarker discovery aims to identify distinct markers or indicators that offer valuable insights into health and disease. These identified biomarkers provide crucial information regarding various aspects. Employing machine learning techniques, such as random forest classification, can further enhance the understanding by providing more in-depth insights, including:
- Facilitating disease diagnosis
- Monitoring and evaluating treatment responses
- Improving comprehension of underlying biological processes
- Enabling the prediction of outcomes.
Microbial R package performms Random Forest Classification then computes the Confusion Matrix as a means of evaluating the model’s performance.
## Biomarkers using microbial package {#microbial-pkg-markers}
library(microbial)

biomarker(ps_raw, group = "nationality", ntree = 129) %>%
plotmarker(level="Genus") +
  coord_flip() +
  theme_test() +
  labs(x = NULL)

Call:
 randomForest(formula = group ~ ., data = data, importance = TRUE,      proximity = TRUE, ntree = ntree)
               Type of random forest: classification
                     Number of trees: 129
No. of variables tried at each split: 8

        OOB estimate of  error rate: 4.95%
Confusion matrix:
    AAM AFR class.error
AAM 116   7  0.05691057
AFR   4  95  0.04040404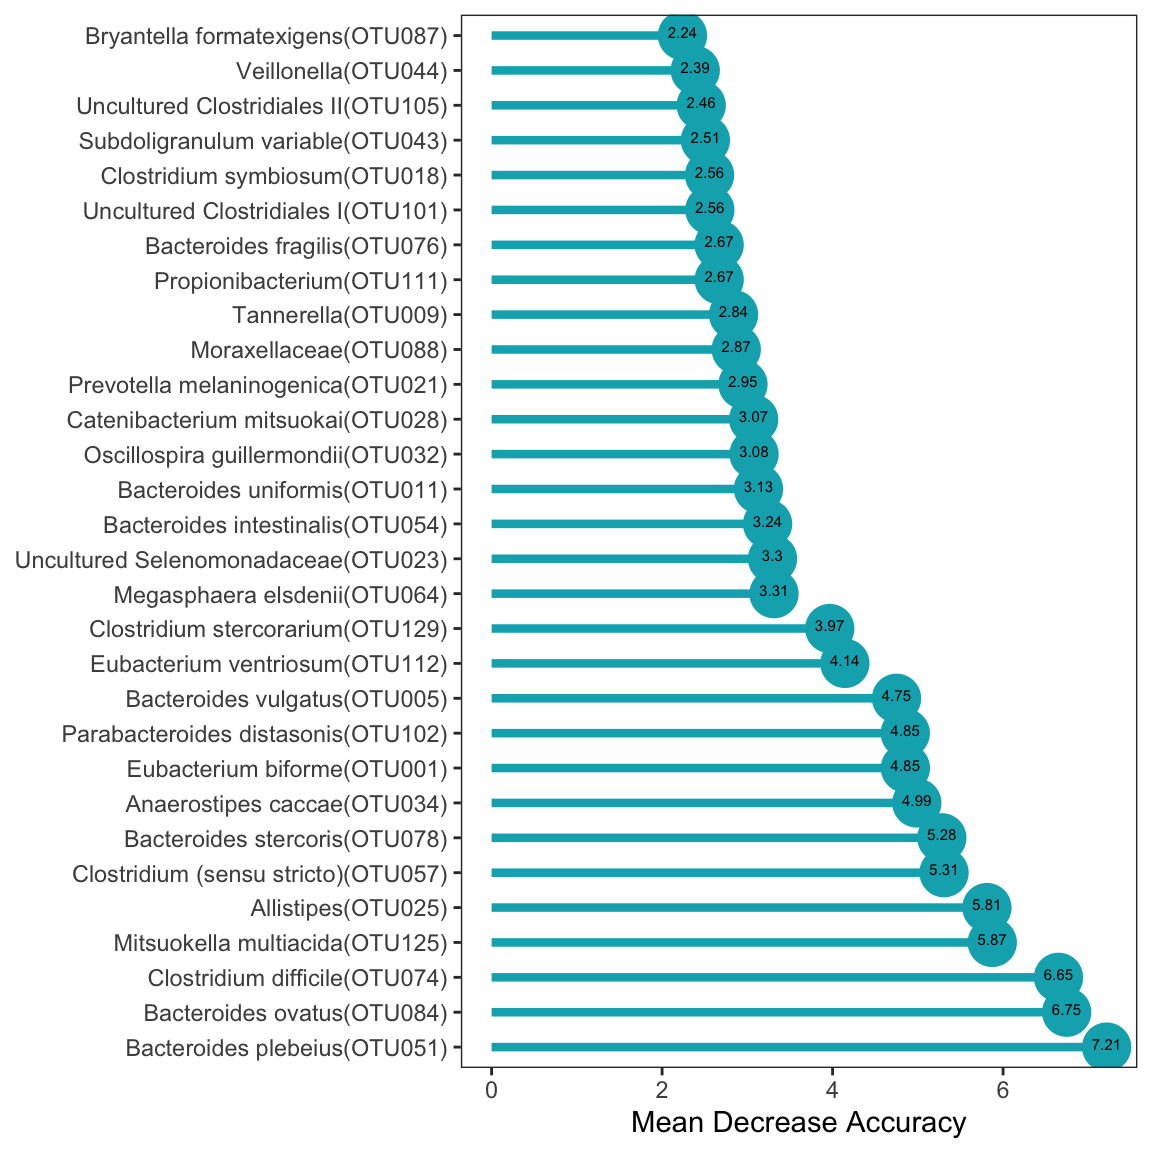
9.1 LEfSe: Linear Discriminant Analysis (LDA) and Effect Size
In microbiome statistical analysis, Linear Discriminant Analysis (LDA) serves as a valuable tool for both classification and understanding the discriminatory power of microbial features. With the vast complexity of microbiome data, LDA aids in deciphering which microbial taxa contribute most significantly to differences between groups.
By examining effect sizes, researchers can pinpoint key microbial features driving group distinctions, shedding light on the biological mechanisms underlying observed differences. This deeper understanding enhances the interpretation of microbiome data and facilitates the identification of biomarkers associated with specific health conditions or environmental factors.
Here we demonstrate the application of LDA and effect size measures in microbiome statistical analysis. Through these examples, we’ll illustrate how these techniques show the relationships within microbial communities and their associations with various biological and environmental factors.
9.2 Fitting LDA models from phyloseq object
library(tidyverse)
library(microbial)

# Fitting LDA models for nationality
lda_nat <- ldamarker(ps_raw, group = "nationality")

# Plotting LDA for nationality (African American vs. African)
lda_nat %>%
  plotLDA(group = c("AAM", "AFR"), lda = 4.5) +
  labs(fill = NULL)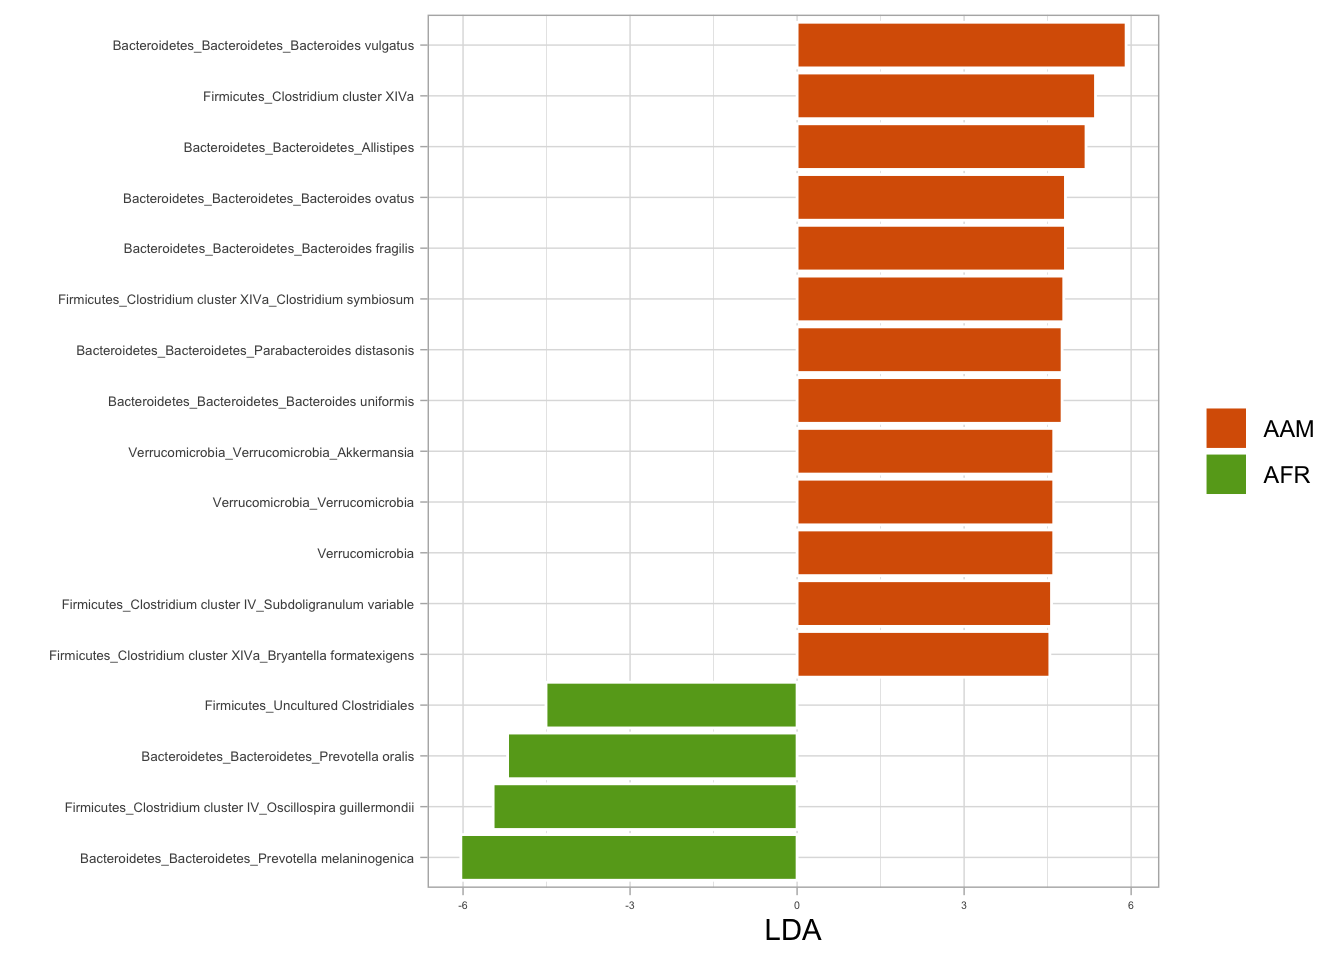
# Fitting LDA models for BMI
lda_bmi <- ldamarker(ps_raw, group = "bmi_group")

# Plotting LDA for BMI (lean vs. overweight)
lda_bmi %>%
  plotLDA(group = c("lean", "overweight"), lda = 4.5) +
  labs(fill = NULL)
# Plotting LDA for BMI (lean vs. obese)
lda_bmi %>%
  plotLDA(group = c("lean", "obese"), lda = 4) +
  labs(fill = NULL)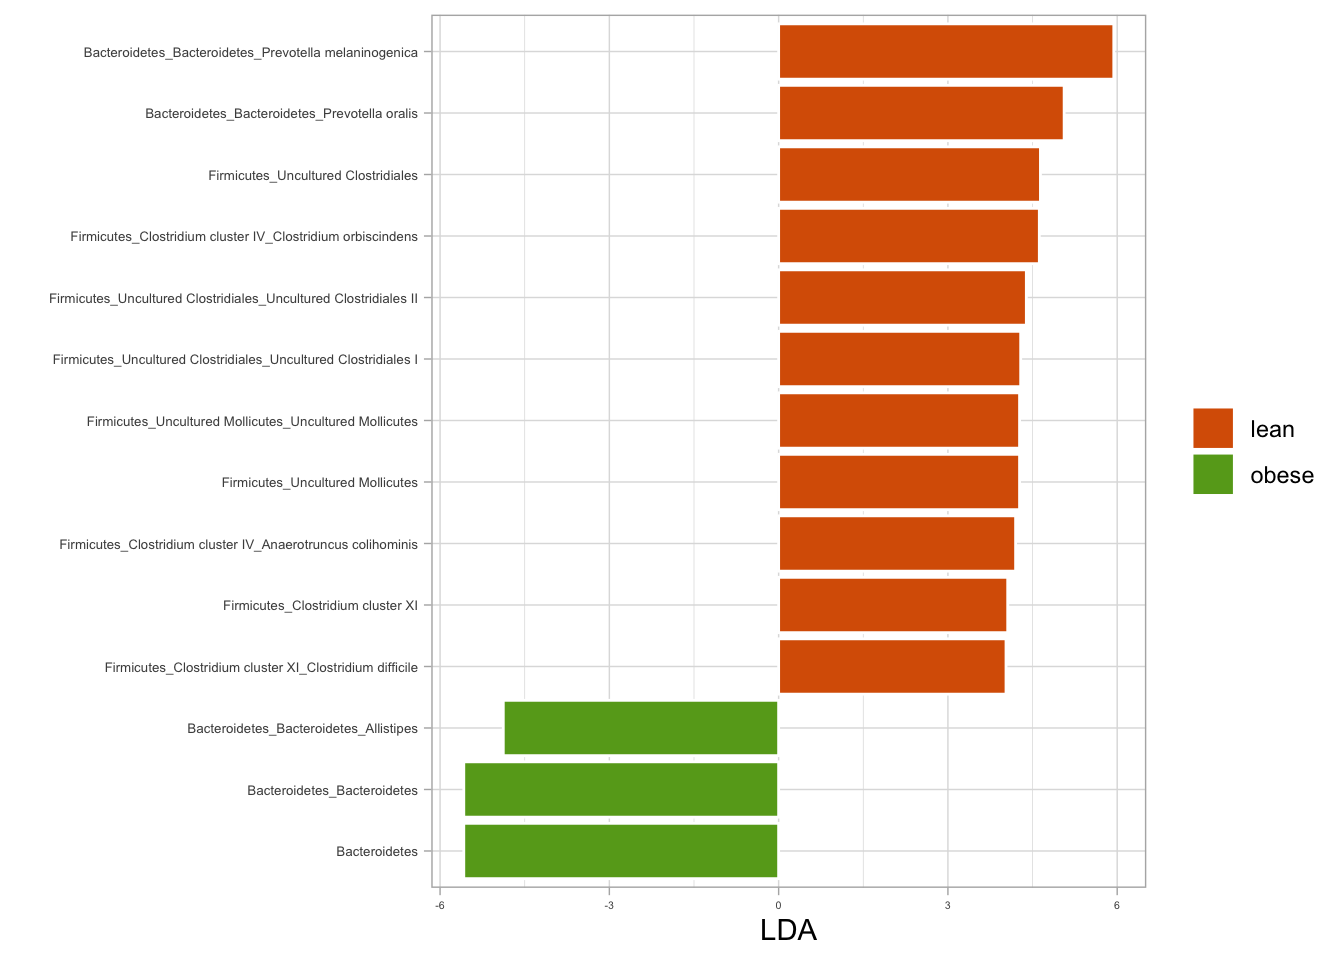
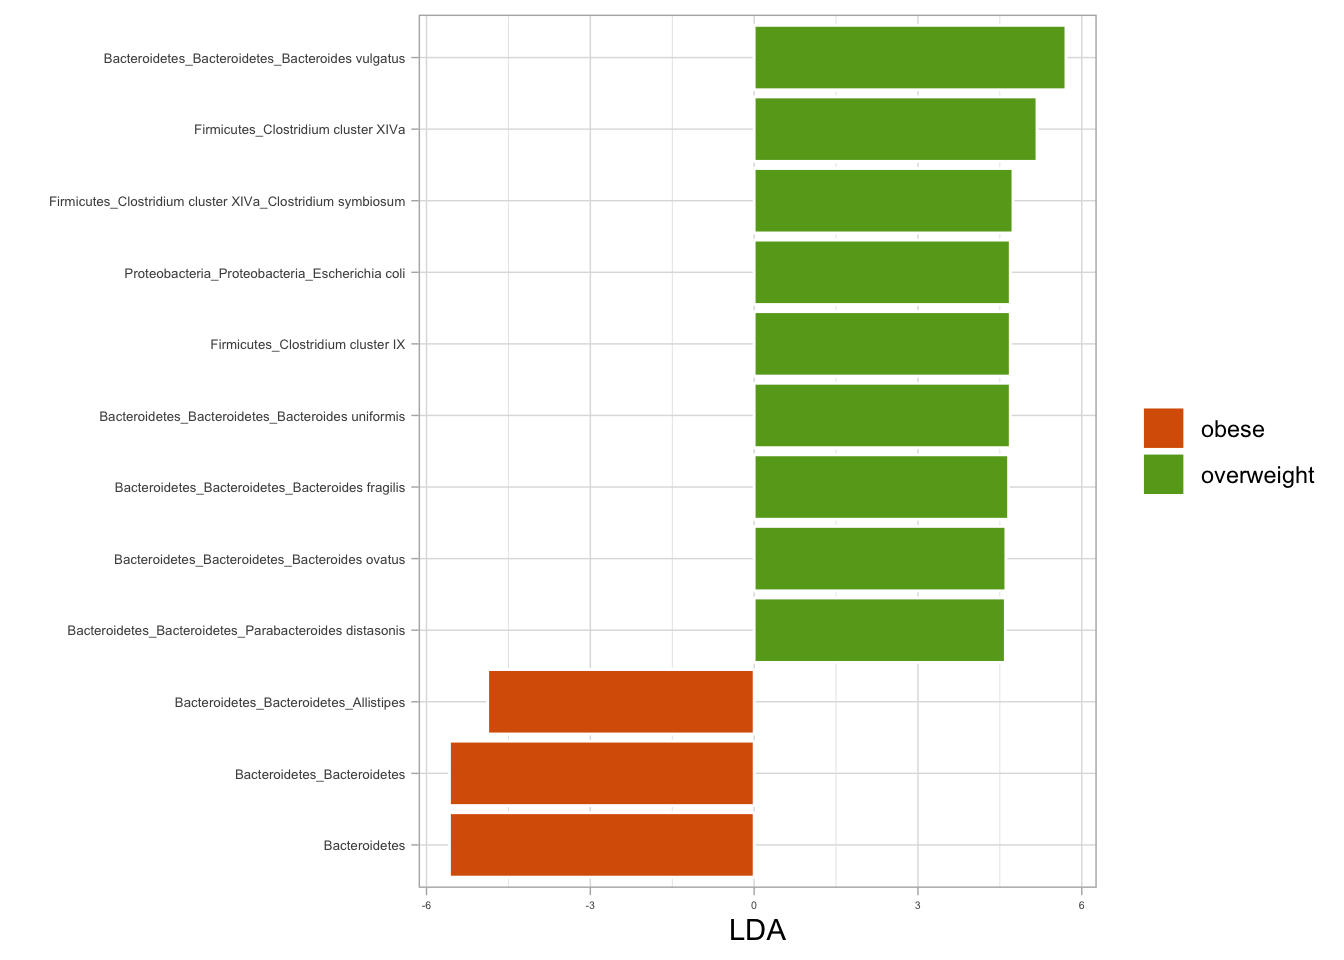
# Plotting LDA for BMI (overweight vs. obese)
lda_bmi %>%
  plotLDA(group = c("overweight", "obese"), lda = 4.5) +
  labs(fill = NULL)