10 Hyperparameter Tuning
In this stage, our objective is to refine the parameters utilized during model fitting to maximize performance. We concentrate on optimizing the model’s effectiveness by fine-tuning various hyperparameters. These parameters, such as regularization strength or tree depth, are manually adjusted to enhance the model’s accuracy. Through experimentation with different values, our goal is to pinpoint the optimal combination that maximizes performance on validation data. This pivotal step ensures that the model not only excels on training data but also generalizes effectively to new, unseen data.
10.1 Demo tuning for a RLR Model
## Loading objects:
##   train_data
##   test_data
load("models/models.rda", verbose = TRUE)## Loading objects:
## mod_glmnet_adcv
## mod_regLogistic_cv
## mod_rf_adcv
## mod_rf_reptcv
## mod_knn_adcv
## mod_knn_reptcv## Loading required package: ggplot2## Loading required package: lattice
library(ggplot2)
# Define the tuning grid
tuneGrid <- expand.grid(
cost = seq(0.001, 1, length.out = 20), # Define a sequence of cost values
loss = "L2_primal", # Specify the loss function
epsilon = 0.01 # Set the epsilon value
)
# Set up cross-validation method
ctrl <- trainControl(
method = "adaptive_cv", # Use adaptive cross-validation
verboseIter = FALSE # Print progress during each iteration
)
# Perform hyperparameter tuning
mod_regLogistic_cv <- train(
target ~ ., # Define the formula for the model
data = train_data, # Specify the training dataset
method = "regLogistic", # Choose the regularized logistic regression method
tuneLength = 12, # Set the number of tuning parameter combinations to try
trControl = ctrl, # Specify the cross-validation method
tuneGrid = tuneGrid # Use the defined tuning grid
)
# Visualize the model performance
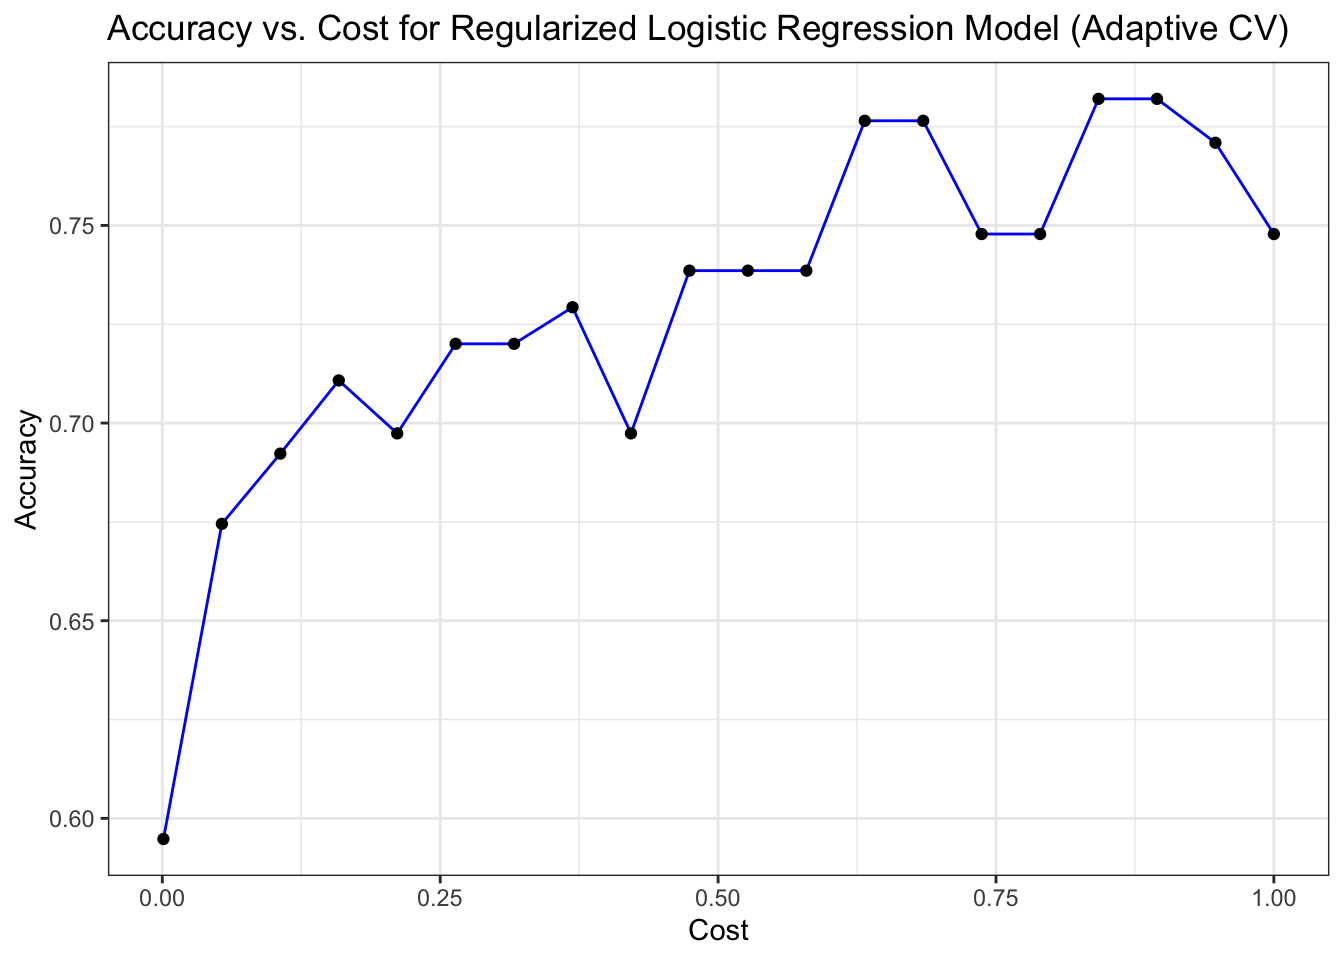
ggplot(mod_regLogistic_cv$results, aes(x = cost, y = Accuracy)) +
geom_line(color = "blue") + # Add a line plot
geom_point(color = "black") + # Add points for each data point
labs(
title = "Accuracy vs. Cost for Regularized Logistic Regression Model (Adaptive CV)", # Set the plot title
x = "Cost", # Label the x-axis
y = "Accuracy" # Label the y-axis
) +
theme_bw() # Apply a black and white theme